In the past, I have been using Remotery, an in-app profiler. I recently became aware of Minitrace, a similar app. So I decided to compare results.
The good news is that when my ray tracer is working in single-threaded mode, the results are in agreement. 6ms or so is spent on uploading the image as texture to OpenGL. The rest of the time is spent rendering scanlines.
 Remotery:
I can also run my app in multi-threaded mode. The scanlines are then rendered in 100 work batches. The batches are processed by four worker threads, that are alive during the lifetime of the app.
 Remotery:
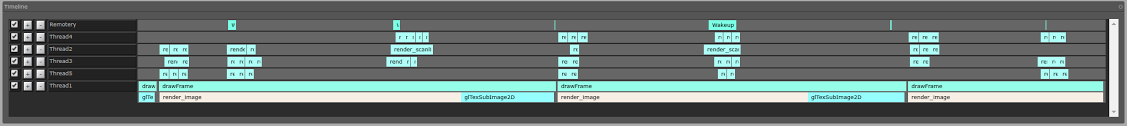
The Minitrace run shows that the worker threads were fully busy during the generation of the image. Sometimes, I see a chunk that take a lot more time (> x10) than normal, which made me doubt the measurement. This was the reason I decided to compare to Remotery. However, now I no longer think this is a bad measurement. One of the worker-threads probably got pre-empted by the OS or something.
The Remotery run, on the other hand, seems to be missing data? Could it be a race-condition between worker threads trying to record events? I'll be creating a github issue, but wrote this blog post first, so that the images are hosted.